How an Algorithm Deepened Inequality in UK A‑Level Results—and What It Teaches Us About AI Fairness

Introduction
In 2020, when the pandemic forced the cancellation of A-level exams, the Office for Qualifications and Examinations Regulation (Ofqual) turned to an algorithm to award grades. This led to high-achieving students at underperforming schools being downgraded while benefiting small class-sized private school students (Harkness, 2021). This post examines how bias arose in the A-level grading algorithm, why it is significant, and how similar issues might be prevented in the future. Having taught A-level mathematics for more than a decade, this is of particular interest to me, and so I will use this case to explore algorithmic bias.
Background
The algorithm introduced by Ofqual relies on historical school performance, prior GCSE attainment and teacher rankings to provide students with their A-level results (Harkness, 2021) to establish group-level statistical consistency over the years, it came at the cost of individual fairness.
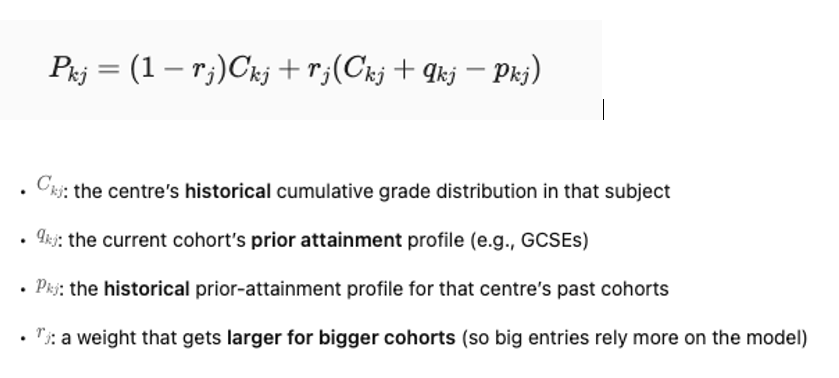
Rather than predicting individual grades, Ofqual first predicted a centre-level grade distribution for each subject, then filled the grade slots using the school’s teacher rank order of pupils. The core centre level formula Pkj used was, where the predicted proportion of grade k in subject j was calculated using the formula:
Once the target distribution Pkj was set, the number of A*, A, B, etc grades were assigned top down by the teacher rank order to match those counts (Bennett, 2020; Ofqual, 2020).1 The result: high-achieving students at underperforming state schools downgraded while small-class private school students often benefited as they were less impacted by cohort adjustments and more on the optimistic teacher’s predicted grade (see Appendix A for sample calculation).
Why Bias Matters
When marginalised or disadvantaged groups are further impacted due to a bias, this can lead to compromising public trust and institutional legitimacy
(Satell Greg & Abdel-Magied Yassmin, 2020). For example, the criminal risk assessment tool, which disproportionately labels Black defendants ‘high risk’ is especially important where disadvantaged pupils are at the receiving end by losing university offers or career choices despite strong academic records. Similarly, Amazon’s AI hiring tool favoured male over female applicants in a male-dominated industry (Dastin Jeffrey et al., 2018)
Sources of Bias in the A-Level Algorithm
Tavares & Ferrara (2023) in their framework, identify areas where bias came from:
- At the data level: historic school performance data reflecting socio-economic inequalities i.e. the model would penalise strong students from disadvantaged backgrounds
- The model’s design: A-level model applied a centre level standardisation; the weight parameter rj gives more weight to historical performance for larger cohorts. i.e. the model is designed such that the larger the cohort, the more the historical grade profile influences the prediction
- The deployment stage: No robust appeal system or stakeholder involvement before rollout, i.e. teachers, students, parents and universities weren’t involved in co-designing or pilot testing at scale. The appeal system required students to prove admin error, for example. Processes of standardisation were only made transparent on results day, triggering backlash.
Mitigation Strategies
While there may not be a perfect, unbiased mathematical model, and a trade-off would need to be established, there are ways bias can be reduced:
- One approach to reducing such bias would be to incorporate socio-economic context to adjust for pupils from disadvantaged backgrounds
- Ensure minority and disadvantaged are adequately represented in the training data (Buolamwini & Gebru T, 2018)
- Stakeholder engagement and governance – involve teachers, students, and equity advocates for risk assessment, quality assurance and model design (Madaio et al., 2020).
- Uncertainty-based debiasing - where the model’s predictions are uncertain, it would be prudent to use advanced AI techniques such as Bayesian neural networks to flag low-confidence predictions for human review and quality assurance (Stone & Shio-Ming, 2024)
Conclusion
The A-level case shows that while perfect fairness may be unattainable, measures and safeguards can be taken to reduce harm and protect trust. Without them, algorithms risk further embedding old inequalities in new systems.
Question for discussion: If we are designing algorithms to predict grades, and inevitably require a trade-off on bias, is it justified to have bias towards more private school pupils from privileged backgrounds than underprivileged state school pupils?
Appendix A
Worked Example — State vs Private School
The core centre level formula Pkj used was, where the predicted proportion of grade k in subject j was given by:
P kj = (1 - rj) . Ckj + rj .(Ckj + qkj – pkj )
Where:
- P kj = predicted proportion of grade k in subject j
- Ckj = historical proportion of grade k at the centre
- qkj = current cohort’s prior attainment profile
- pkj = historical prior attainment profile
- rj = weighting factor — higher for larger cohorts
State school:
Large cohort (rj = 0.8), historic A rate CAJ = 5%
- Teacher-predicted A*: 4 out of 20 students (20%)
- Calculation:
P kj = (1 – 0.8) × 0.05 + 0.8 × (0.05 + qAj – pAj)
Even if qAj suggests improvement, the 80% weighting to history means the A proportion stays close to 5% → only 1 student gets an A, even if several meet the criteria.
Private school:
Small cohort (rj = 0.2), historic A rate 25%
PAj = (1 – 0.2) × 0.25 + 0.2 × (0.25 + qAj – pAj)
- Teacher-predicted A: 4 out of 8 students (50%)
- Low rj means predictions dominate therefore likely all 4 keep their A.
References
Bennett, S. (2020). On A Levels, Ofqual and Algorithms · Sophie Bennett. 2020. https://www.sophieheloisebennett.com/posts/a-levels-2020/
Buolamwini, J., & Gebru T. (2018). Gender Shades: Intersectional Accuracy Disparities in Commercial Gender Classification — MIT Media Lab. https://www.media.mit.edu/publications/gender-shades-intersectional-accuracy-disparities-in-commercial-gender-classification/
Dastin Jeffrey, Weber Jonathan, & Dickerson Marla. (2018). Insight - Amazon scraps secret AI recruiting tool that showed bias against women | Reuters. https://www.reuters.com/article/us-amazon-com-jobs-automation-insight-idUSKCN1MK08G/
Harkness, T. (2021). A level results: Why algorithms aren’t making the grade - BBC Science Focus Magazine. https://www.sciencefocus.com/future-technology/a-level-results-why-algorithms-arent-making-the-grade
Madaio, M. A., Stark, L., Wortman Vaughan, J., & Wallach, H. (2020). Co-Designing Checklists to Understand Organizational Challenges and Opportunities around Fairness in AI. Conference on Human Factors in Computing Systems - Proceedings. https://doi.org/10.1145/3313831.3376445/SUPPL_FILE/PN4965AUX.ZIP
Ofqual. (2020). Requirements for the calculation of results in summer 2020. https://assets.publishing.service.gov.uk/media/5f3e125cd3bf7f1b13f65134/6674_Requirements_for_the_calculation_of_results_in_summer_2020_inc._Annex_G.pdf?utm_source=chatgpt.com
Satell Greg, & Abdel-Magied Yassmin. (2020). AI Fairness Isn’t Just an Ethical Issue. https://hbr.org/2020/10/ai-fairness-isnt-just-an-ethical-issue
Stone, R., & Shio-Ming. (2024). Visual bias mitigation driven by Bayesian uncertainties.
Tavares, S., & Ferrara, E. (2023). Fairness and Bias in Artificial Intelligence: A Brief Survey of Sources, Impacts, and Mitigation Strategies. Sci 2024, Vol. 6, Page 3, 6(1), 3. https://doi.org/10.3390/SCI6010003
Acknowledgements
This work was developed with the assistance of ChatGPT (GPT-5, August 2025 version), which was used as a tutoring and research aid. All sources generated or suggested by ChatGPT were independently verified and cited in the references.